Data-driven Vs Data-Informed Decision-making in UX Design

Priya Kavdia
In God we trust, all others bring data. W. Edwards DemingThis quote showcases the importance of data and that many UX designers and entrepreneurs dont trust anything but the DATA gods, as the numbers tell you what you need to know about the business market. This is what we call being data-driven.Data is a tool for enhancing intuition. Hilary MasonNow, this quote here defines data as a tool for the intuition that drives the whole UX design process. This sums up what being data-informed is all about.These two approaches may seem like opposites at first glance, but well eventually explain how these two wheels of the bicycle need each other for a successful UX design project.If youre a UI UX designer, this blog will enlighten you on capitalising on both approaches to win. If youre an entrepreneur, then let us guide you to every detail about data-driven and data-informed decision-making so that you can go on to find a design team that can help you choose what is right.

What is Data?
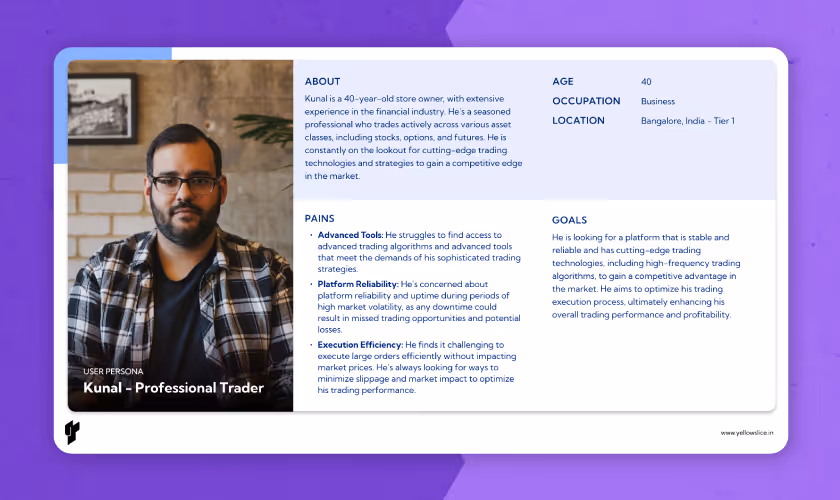
Data is factual information (such as measurements or statistics) used as a basis for reasoning, discussion, or calculation.In simple terms, Data is something that helps you make a decision.In the modern world, all decisions, whether made by you or MNCs, are based on data. For instance, when buying a laptop, you look at data such as customer ratings and reviews, in-depth explanations, specifications, and more. All of this data eventually helps you make a decision.Similarly, UI UX designers use various data to make well-informed decisions. Some include usability testing, data analytics, user feedback, and user personas, which help better understand user behaviour, make more accurate predictions, and make more efficient designs.
Types of Data You Can Consider in Making UX Decisions
Data helps you make decisions in the UX design process, but its also essential to know the different types of data and how they can be helpful. Data can be divided into types based on sources, characteristics, and collection methods.
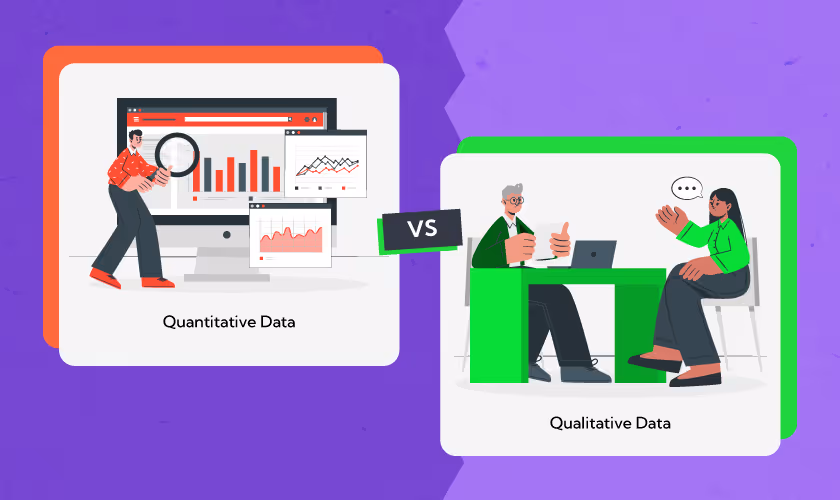
Quantitative DataQualitative DataThis data is objective and numerical, including the task success rate (TSR), time on task (TOT), error rate, etc.This data is subjective and based on user feedback. It can be gathered from usability testing, user interviews, heat maps, etc.Answers questions like how many and what.Answers questions like why and how.Provides concrete measurements to quantify user needsProvides context and understanding about the user needs.Other examples of quantitative data are clicks, session rates, and bounce rates.Qualitative data include open-ended survey responses, interview transcripts, and observational notes.Data can also be divided into two more categories based on the source of data collection: Primary and Secondary data.Primary data are collected first-hand, while secondary data validate your existing design and Primary data. Examples of Primary data include surveys, interviews, and usability tests. Examples of Secondary data include market research, study of trends, and industry findings.
Why is Data Important in UX Design?
Data in UI UX design works as a north star for designers; they follow it to reach the perfect (almost) design project. Data helps designers make accurate predictions; the following are the other reasons why data is necessary for UX design:
Brings Accountability
Without data methods like A/B testing, designers must rely on a CTA toggle mentioned on the website to get the expected returns. However, if they spent some of the budget on A/B testing, they would know precisely what the design lacks.
Helps Form User Persona
When you use metrics like click-through, retention, and bounce rates, you understand your users' likes, dislikes, expectations, and risks. This helps you form a user persona that you can cater to rather than designing something that does not have a targeted audience in the first place.
Defines Success Metrics
Without data gathering, designers cant define success. No matter how much effort you put into a design project, if you cant show your client what youve done is fruitful, its of little to no use. Define success with metrics like engagement, conversion, and user satisfaction.
How to Use Data in UX Design?
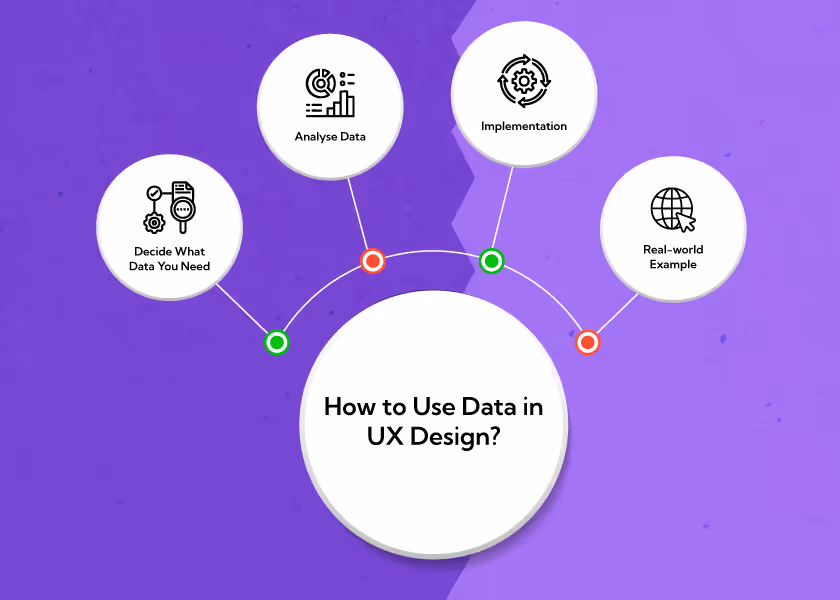
But how do we efficiently incorporate the data in the UX design process? Lets dive in to know the answer to this question.
Decide What Data You Need
Define your project goals and expectations before collecting and analysing data. This will help you decide which data most impacts your businesss KPI.
Analyse Data
After data collection, analyse the data thoroughly to identify patterns and trends that need to be followed in the present design and that need to be unfollowed.
Implementation
Implement the information that youve gained after the data analysis. Perform A/B besting of all possible actions to know which works best.
Real-world Example
Amazons one-click shopping feature results from implementing data insights to achieve high user satisfaction.

What is Data-driven Design?
When decisions are made solely based on quantitative data with little to no regard for subjective knowledge during the UX design process, that design is data-driven.Quantitative data include user interactions, website metrics, conversion rates, click-through rates, bounce rates, user engagement, retention, feature usage, net promoter scores (NPS), drop-off, and overall user satisfaction.For instance, if your sales drop on an eCommerce website, data analytics can provide insights, such as the possibility that the checkout process is complicated for potential customers. This is why users leave their carts and the reason for the high cart abandonment rate.Data-driven design works because numbers dont fail you, and they are objective knowledge about product functionality. Other characteristics of data-driven design include:
- Stakeholders and designers can define and observe measurable results.
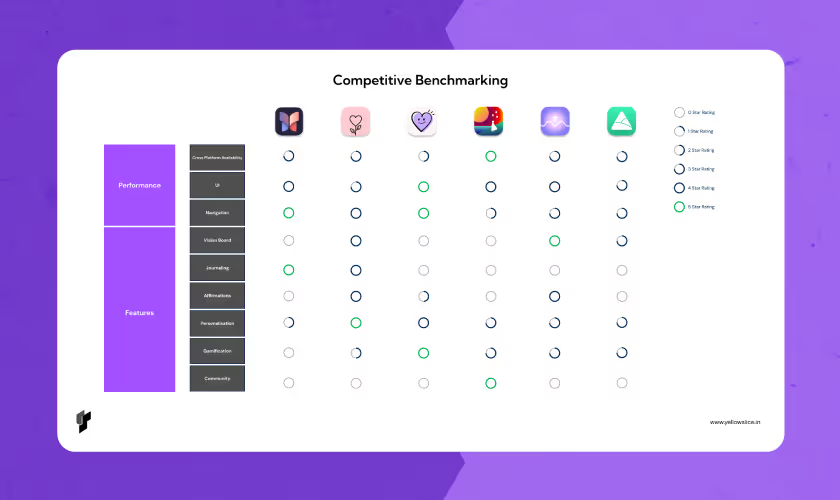
- UX research methods used in data-driven decision-making include detailed surveys, usability testing, behaviour flows, competitor analysis, and others.
- Data almost works as designers' right hand, guiding them to the next step at every stage of the design process.
- Accumulating data wont give you many results on its own, though. An analyst who can analyse the data and give actionable recommendations is very much needed, too.
How Do You Make Data-driven Decisions?
Wish to make a design thats data proof? Use the following tried and tested practices, methods, tools, and resources to make data-driven decisions:
Make Way for A/B Testing
Another name for A/B testing is split testing. Its a research method that tests two versions of a feature or page to determine which one works better. Knowing which hypotheses work best is essential before delivering the product to users.There has to be some significant difference between the two variants. The difference can be in the webpage, in terms of elements, such as a change in the shape of the call-to-action button.As an actionable move, a designer can split the user base 50-50 or choose a small sample size from a large pool of users. Provide different groups with different product versions to determine which version, i.e., which elements, are bringing more conversion rates.
Perform Multivariate Testing
Multivariate testing and A/B testing can be confusing. The former involves changing multiple elements simultaneously to test which combination of variations outperforms the other combinations.At the end of this testing's implementation, designers will be enlightened on how various elements of design influence user experience with a single test. Its an efficient method of examining complex layouts and various elements simultaneously.For instance, performing multivariate analysis on different landing page elements, such as headlines, images, written copy, and the colours of call-to-action buttons, can save a lot of time.Websites and apps with various interactive elements and features that demand significant changes can be challenging to test with A/B testing; hence, multivariate testing comes into play.
Observe Analytics
To make data-driven decisions, designers must observe different analytics, i.e., quantifiable metrics such as unique page/screen view, time spent on a page, number of pages viewed per session, and bounce rate.Analysing important analytics informs you about what part of the product users find most engaging and what part needs attention.Take advantage of tools like Google Analytics, product metrics, social media analytics, email analytics, etc., to understand user flow and demographics such as age, location, habits, and interests.This study will help you meet user expectations better as a UX designer.
Analyse Surveys
Structured and detailed customer surveys provide direct feedback and can help form a data-driven design. Like questionnaires and interviews, surveys have been a part of research methodology for a long time.They let designers peek into users' expectations, preferences, motivations, and opinions so they can tweak a few features in the design to achieve the desired results.Surveys can be coupled with usability testing, another technique for observing user behaviours. Get your users to use the product and have them complete surveys right after this practice to identify pain points.For instance, if youve designed a new checkout process and conducted usability testing on it, you may find in the survey that users find it challenging to find the Pay button.
What is Data-informed Design?
It's a slightly different term but another take on the design process. Being data-informed means giving data its due respect but incorporating several other inputs in the decision-making process, like,
- Projects objectives and expected results (OKRs)
- The designers subjective expertise and intuition
- The context of the problem
- Business History
For instance, if an app's designers consider changing its UX design, but the data shows that the engagement rate will be negatively impacted and not impact its conversion rate, should it take the risk? We say yes. If the designers have done contextual research well and have solid, subjective reasons for why these changes will lead to positive results, they should give them a green light.Data-informed decision-making practitioners believe that data gods are not the ultimate source of the information needed to make an efficient UX design. Other characteristics of data-informed design include:
- Data-informed decision-making looks at the bigger picture more than data and trends.
- This practice also works well when a product doesnt have much information or data available on the internet to search for, so you have to rely on subjective knowledge.
- A data-informed UX design is based on user behaviour patterns and results from a study of why users behave the way they do. Think like a psychologist in UX design.
- This approach focuses on contextual analysis and is better suited for more innovative and less traditional projects.
- Tools and techniques used in a data-informed UX design include user research, personal experience, and third-party insights.
How to Make Data-informed Decisions
Following practices lets you make a UX design thats not just based on mere digits:
Numbers Arent Everything
Data isnt the end-all-be-all. It can indeed show you what has happened in the past and what is happening right now, but can it predict the future? Not all the time; data scientists can not guess, at least, the significant trends that happen inevitably.For example, remember the BlackBerry phones with QWERTY keypads from 2007 to 2008? Tech analysts believed that BlackBerry phones were the future of mobile phones, but do you see them anywhere now? No, touchscreen phones have taken the world by storm.These significant trends and technological innovations cant be predicted with mere numbers.
Subjectivity>Objectivity
Focus on subjectivity more than objectivity to create a data-driven design. Designers use empathy and intuition to guide them through the how and why of the design process.No amount of numbers is enough to deny the fact that customer insights are very much needed to create a UX design process.Designers cant take the shortcut of considering some numbers without incorporating experiential wisdom into decision-making. Creating a personalised customer experience that forms long-term relationships requires subjective knowledge without bias.For instance, youve realized that customers from a specific demographic need a new feature in the app. If you add that feature, you could tap into this new market of customers. However, this feature doesnt align with your project plans. Thats a subjective decision you must make as a UX designer if you want to incorporate that feature.
Quality> Quantity
When it comes to data, the saying the more the merrier doesnt go well. If your data doesnt answer all your questions and project objectives, what good is it?Being data-informed as a designer means prioritising data, which is essential. Data quality suffers from bias, such as sampling errors or stereotypes. A large amount of biased data will result in false conclusions.
Data-driven vs Data-informed Decisions: Pros and Cons

Pros
Data-Driven DecisionsData-Informed DecisionsThe data-driven approach is free of biases, as the decisions are based on facts and not personal insights.Data-informed UX design results from strategic direction, combining quantitative data and historical experience.In a data-driven UX design, the designer shares the responsibility of the end product with data.It encourages cross-functional collaboration across teams, as insights are drawn from customer-dealing departments such as marketing, sales, and customer support.Characteristics like transparency and proactivity make the data-driven approach highly reliable. Predicting future market trends becomes easy.Data-informed decision-making is a continuous process that creates a feedback loop. Even after completion, new knowledge is gained, and changes are made over time.
Cons
Data-Driven DecisionsData-Informed DecisionsA data-driven approach doesnt work for a product that is supposed to tap into a new market. Since there is no historical data on which designers can optimise.Data-informed approaches can involve biased decision-making, leading to confusion as the designers look at multiple elements simultaneously.
Challenges of Over-relying on One Approach
Designers often make the mistake of trusting just one approach and ignoring the upsides of other approaches. The challenges then they face can look something like this,
Analysis Paralysis
Relying heavily on just one approach can lead to analysis paralysis. Its a state where you cannot take any decision (youre paralysed) because youve thought of too many options while analysing.If a designer keeps looking at numbers for every decision he/she makes, the end UX product will result from analysis paralysis, and nothing good will come from it.The same goes for data-informed decision-making; as there are too many elements to analyse and compare, the designer may get flabbergasted by all the elements and not know which one to prioritise.
Different Project Asks for Different Approaches
If the problem statement has data roots, a data-driven approach is the way to go. For instance, a data-driven solution is required if the cart abandonment rate has dropped to 50%.However, if the problem is more complex, the data-informed decision would be more appropriate, as it requires a qualitative check. Maybe your brand image needs a change.
Bridging the Gap: Integrating Data-driven and Data-informed Approaches
Now that youve learned the differences between data-driven and data-informed approaches lets learn how to use both to bridge the gap and benefit from both.
Leverage Qualitative and Quantitative Data
Numbers are not equal to data. Data can also be qualitative. Customer-centric designers combine qualitative and quantitative data to create a product.Some tools and methods that showcase user behaviour include Heatmaps, recordings of customer journeys and customer surveys. Heatmaps are graphical representations of data. They use a complex colour coding system to showcase different values, representing how users interact with different web pages, such as where they click, scroll, and tap.Recording customer journeys lets you see which features on the web page or app users find challenging to navigate, and it gets frustrating for them to move forward in their journey.
Best Practices for UX Teams To Integrate Both Strategies
Many designers believe that data removes their creative liberty and simultaneously serves as a guiding light.It is not wise to base your decisions entirely on numbers, and it is not a great idea to base your decisions entirely on intuitive thoughts. As a designer, you might end up optimising for the wrong reasons. Finding that balance in the right spot is crucial.
Conclusion
In conclusion, we want to show how flexibility can strengthen a UX design process. UX designers who incorporate both approaches, incorporating the best of both worlds.Keep in mind that data-informed decisions require validating success metrics for data-driven parameters. At the same time, data-driven metrics should make sense beyond numbers post-execution.If you plan to design a data-driven and data-informed UX product, contact us at Yellow Slice and experience a design process like never before.
FAQs aboutData-driven Vs Data-Informed Decision-making in UX Design
1. How can teams become data-informed and not data-driven?
Incorporating the data-informed approach has its challenges. However, investing in the necessary tools and technology, like Google Analytics and Hotjar, can help teams analyse effectively. Give your teams access to these tools and encourage them to learn about these resources.
2. What is the difference between data-driven and data-inspired decision-making?
In Data-driven decision-making, numerical data dictates your UX design process. On the other hand, data-inspired decision-making, as the name suggests, is only inspired by data and takes a more holistic approach.

Let's create something amazing!
Let's discuss your vision and how we can bring it to life with impactful design solutions.
.avif)
Good design starts with Sliced Newsletter
Subscribe to the Sliced newsletter and get the best of research, UX writing, product psychology, CX, and design systems, right in your inbox.
